How to DEBUG Django
Learn how to DEBUG Django and activate Logging
Logging and Debugging are essential aspects of any web application, as it allows developers to record and analyze the execution of their code, making it easier to identify and resolve issues.
In a Django application, proper logging can not only save valuable time during development and debugging but also help you ensure the stability and security of your application in production.
In this article, we will discuss the importance of logging and debugging in Django applications. Our journey will be divided into three key sections:
- Configuring Django for Logging
- Using
pdbin a Django Application - Configuring Django Debug Toolbar

✅ Project Setup
For this article, you can find the code on GitHub at How to DEBUG Django Sample.
To make things quicker, you can clone this specific commit so you can follow the tutorial.
$ git clone https://github.com/app-generator/sample-django-debug.git
$ cd sample-django-debug
Once the project is set up, you can install the dependencies and start the Django project.
$ virtualenv env
$ source env/bin/activate
$ pip install -r requirements.txt

$ python manage.py migrate
$ python manage.py runserver
✅ Configuring Django for Logging
Django natively integrates logging using Python's built-in logging module. This integration allows developers to easily track events, monitor application behavior, and diagnose issues.
Django allows you principally to use the default logging system or to create your custom loggers.
Default logging settings
Django provides a default logging configuration that is applied if you don't explicitly configure logging in your settings.py.
This default configuration logs messages with the WARNING level and above to the console. In DEBUG mode, Django also logs SQL queries.
Custom loggers
Django allows you to create custom loggers for your applications by defining the LOGGING dictionary in your settings.py file, as explained in the previous answer.
This gives you full control over the logging behavior of your application, allowing you to configure loggers, handlers, filters, and formatters to meet your specific requirements.
We will write our configuration for Logging in the next lines.
✅ Custom Logging Settings
As stated in the previous section, customizing the Logging in Django add the following configuration in core/settings.py.
# core/settings.py

...

LOGGING = {
    # Define the logging version
    "version": 1,
    # Enable the existing loggers
    "disable_existing_loggers": False,
    "formatters": {
        "default": {
            "format": "%(asctime)s %(name)-12s %(levelname)-8s %(message)s",
        },
        "django.server": DEFAULT_LOGGING["formatters"]["django.server"],
    },
    # Define the handlers
    "handlers": {
        "apps_home": {
            "level": "DEBUG",
            "class": "logging.FileHandler",
            "filename": "logs/apps_home.log",
        },
        "console": {
            "level": "DEBUG",
            "class": "logging.StreamHandler",
            "formatter": "default",
        },
    },
    "loggers": {
        "apps.home": {
            "handlers": ["apps_home", "console"],
            "level": "DEBUG",
            "propagate": False,
        },
    },
}
Let's explain the code we have above :
👉
General configuration
- version:
1- The version key is set to 1, indicating that this is a version 1 schema for logging configuration, which is the default and only version available for the logging configuration in Python's logging module.
- disable_existing_loggers:
False- This setting controls whether or not to disable all existing loggers when the configuration is applied. By setting it to
False, the existing loggers are enabled.
- This setting controls whether or not to disable all existing loggers when the configuration is applied. By setting it to
👉 Formatters
- default
- A custom formatter with the format string
"%(asctime)s %(name)-12s %(levelname)-8s %(message)s". This format includes a timestamp, logger name, log level, and the log message.
- A custom formatter with the format string
- django.server
- This formatter is the same as the default formatter for the
django.serverlogger.
- This formatter is the same as the default formatter for the
👉 Handlers
- apps_home
- A file handler that logs messages with a log level of
DEBUGand above to a file namedlogs/apps_home.log.
- A file handler that logs messages with a log level of
- console
- A stream handler logs messages with a log level of
DEBUGand above to the console (standard output). This handler uses thedefaultformatter defined earlier.
- A stream handler logs messages with a log level of
👉 Loggers
- apps.home
- A logger for the
apps.homemodule (replace this with the actual name of your application or module). This logger has two handlers,apps_homeandconsole, which means it will log messages to both the specified log file and the console. The log level is set toDEBUG, so it will log messages with a level ofDEBUGand above. Thepropagatekey is set toFalse, which means that the log messages handled by this logger will not be passed to higher-level loggers (e.g., the root logger or thedjangologger).
- A logger for the
This LOGGING configuration provides a custom logging setup for the apps.home module in a Django application we can use and test.
First of all, create a new folder called logs at the root of the project. This directory will contain the log files of this project. Then, add a file to this newly created directory.
cd logs && touch apps_home.log
After that, add a file called loggers.py at the root of the project. This file will contain the declaration of the custom loggers.
import logging

# Home application logging

apps_home_logger = logging.getLogger("apps.home")
The resulting logger instance, apps_home_logger can be used throughout the apps.home application to log messages. This logger is already configured in the Django settings (like in the LOGGING dictionary you provided earlier), so it will use the handlers, formatters, and log levels you specified in the configuration. To log messages with this logger, you can use its methods, such as apps_home_logger.debug(), apps_home_logger.info(), apps_home_logger.warning(), apps_home_logger.error(), and apps_home_logger.critical().
Great! Let's now write a view that should return a 500 error page. In the core/views.py file, add the following function.
from logging import CRITICAL
from django.contrib.auth.models import User
from django.shortcuts import render
from loggers import apps_home_logger
...
def test_logs(request):
users = User.objects.all()
try:
a = 1 / 0
return render(request, "pages/index.html")
except ZeroDivisionError as e:
apps_home_logger.log(CRITICAL, msg=str(e))
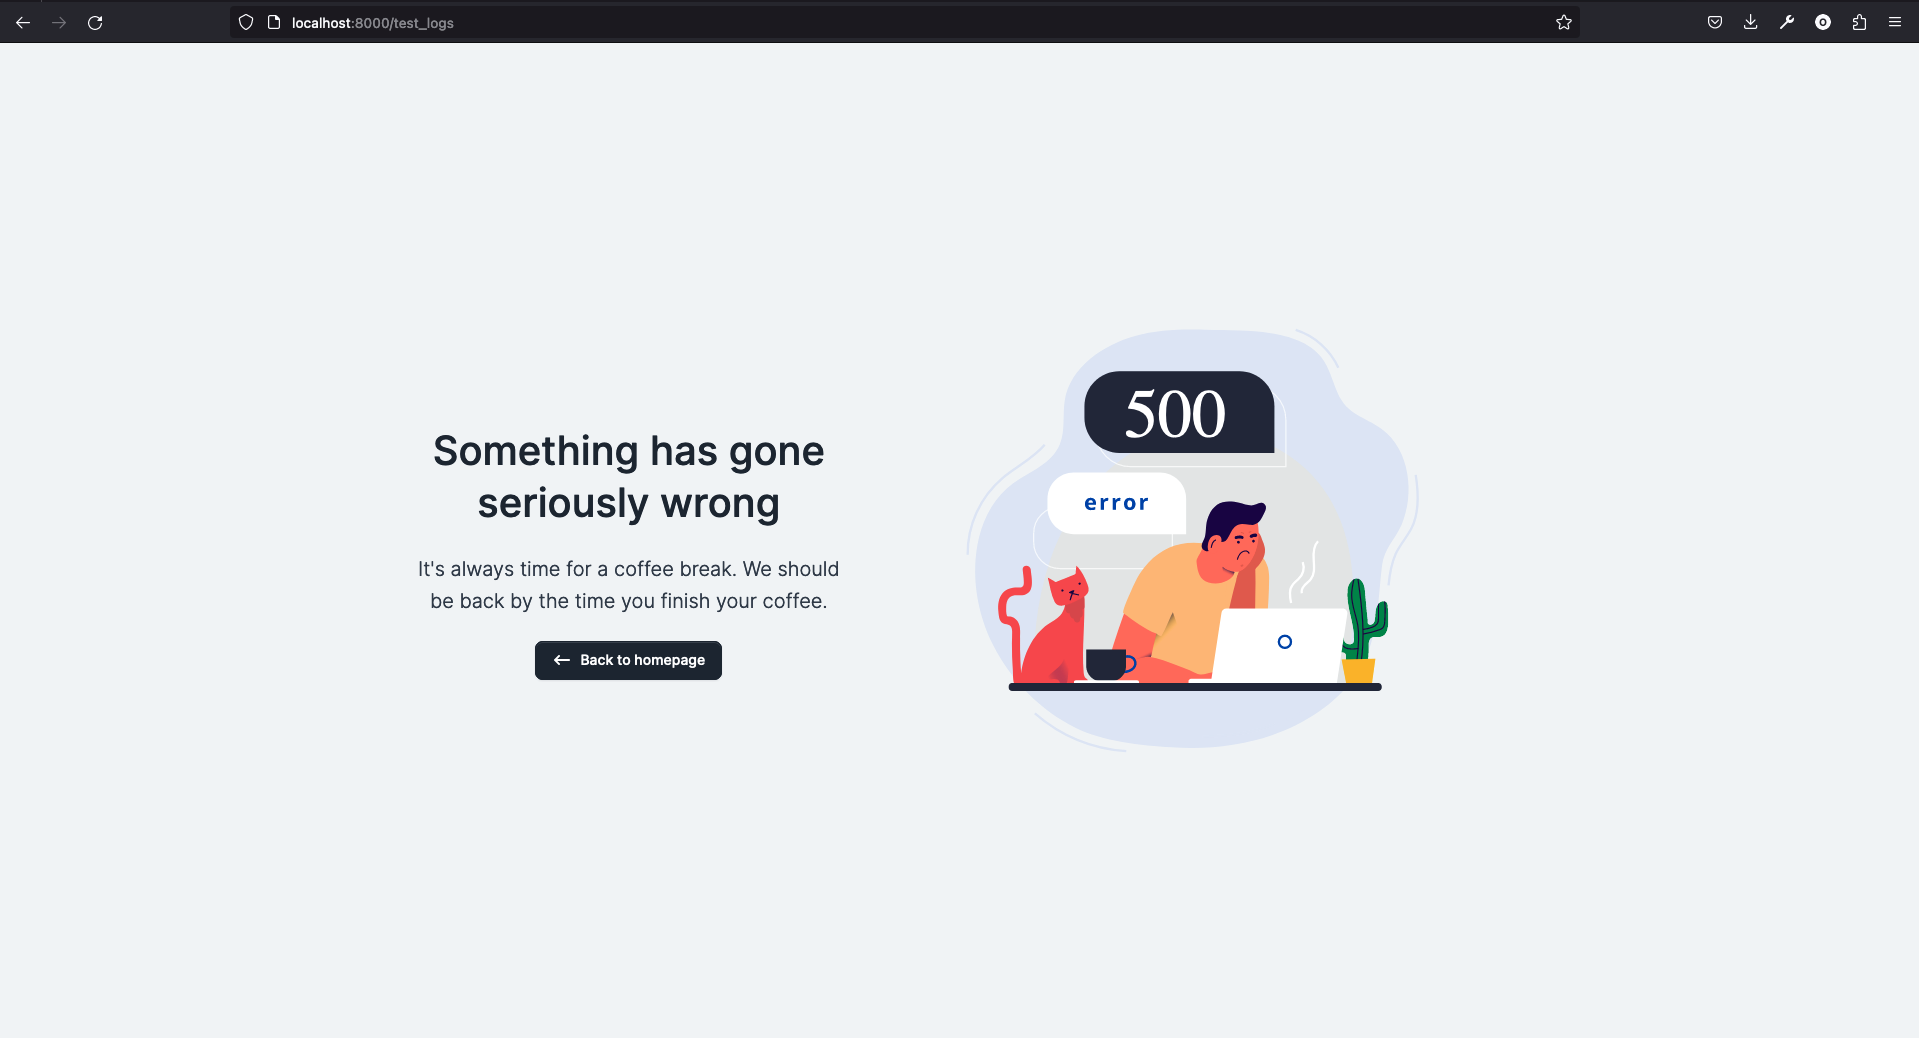
return render(request, "pages/examples/500.html")
This code is part of a Django view module that demonstrates how to use the custom apps_home_logger for logging critical errors. The view function test_logs deliberately raises a ZeroDivisionError and logs the error message using the custom logger.
Visit the project at this link : http://localhost:8000/test_logs and you will see the current result
And you can check the logs/apps_home.log and you will see the content.
division by zero
And we have just logged our first error. Using the logging feature integrated with Django, we have built a custom logger we can use across the whole Django application to log errors. 🚀
In the next section, we will explore how to use pdb for debugging in a Django application.
✅ Using PDB for Debugging
pdb, short for "Python Debugger", is a built-in Python module that provides a way to interactively debug your code.
You can use pdb in a Django application to debug your views, models, or other code within the app. We will use pdb in the test_logs view by adding pdb.set_trace() after the line users = User.objects.all().
...
def test_logs(request):
    users = User.objects.all()

    pdb.set_trace()
...
The line pdb.set_trace() is used to create a breakpoint in your Python code when using the pdb debugger.
When the code execution reaches this line, it will pause and open an interactive debugging session in your terminal or console.
At this point, you can interact with the debugger using various commands to inspect the variables, step through the code, execute arbitrary code, and more. This helps you identify and fix issues in your code more efficiently by providing an interactive debugging environment.
Here are some useful pdb commands you can use during the debugging session:
n(next): Execute the next line in the current function.s(step): Execute the current line and stop at the next line, stepping into function calls.c(continue): Continue the execution until the next breakpoint or the end of the program.q(quit): Quit the debugger and exit the program.p(print): Print the value of an expression or variable. For example,p variable_name.pp(pretty-print): Pretty-print the value of an expression or variable.l(list): List the source code around the current line.h(help): Show a list of available commands.
Visit this URL again http://localhost:8000/test_logs and go on the terminal when you are running the Django server and let's type some commands.
You can check the results of these commands typed in the image below.

To quit the interactive debugging terminal, just type q and Django will continue the execution of the code.
Pdb is a great tool you can use in development to leverage your debugging requirements in a Django application.
However, it's not recommended to use pdb.set_trace() in a live, production environment, as it may cause the application to hang when it reaches the breakpoint. Use pdb only during development and testing.
If you're using Python 3.7 or later, you can use the built-in
breakpoint()function instead ofpdb.set_trace(). To do this, simply replace thepdb.set_trace()line with:breakpoint()By default, this will invoke
pdb, but it can be customized to use other debuggers if needed.
We now understand how to use pdb to debug in our Django application.
However, you might also want to have real-time data and a better description of errors when building a web application or an API with Django.
In the next section, we will learn why and how to use django-debug-toolbar.
✅ Integrating django-debug-toolbar
As a developer, you might have already faced issues such as performance issues, SQL queries, template rendering issues, and more, all within the context of your application.
Django Debug Toolbar is a third-party package that provides a set of panels displaying various debug information about the current request/response in your Django application.
It is an essential tool for Django developers and it can help you with the following issues:
Performance analysis
It allows you to analyze the performance of your views, identifying potential bottlenecks and slow database queries.
SQL query inspection
It provides detailed information about the SQL queries executed during a request, including their execution times and the ability to see the full query with parameters.
Template debugging
It displays the context and inheritance of your templates, making it easier to debug template-related issues.
Cache usage
It shows cache usage statistics, helping you optimize your application's caching strategy.
Signals
It displays a list of signals triggered during the request, which can be useful for debugging signal-related issues.
Request/response data
It provides information about the request and response, such as HTTP headers, cookies, and more.
Let's install the package and configure it in our Django application. First of all, install the package using pip.
pip install django-debug-toolbar
Next, Add the package Django application to your INSTALLED_APPS. In your Django project's settings.py file, add 'debug_toolbar' to the INSTALLED_APPS list:
...
# Application definition

INSTALLED_APPS = [
    "admin_volt.apps.AdminVoltConfig",
    "django.contrib.admin",
    "django.contrib.auth",
    "django.contrib.contenttypes",
    "django.contrib.sessions",
    "django.contrib.messages",
    "django.contrib.staticfiles",
    "debug_toolbar", # <- Django debug toolbar
    "home",
]
...
The next step is to add the middleware. In the settings.py file, add 'debug_toolbar.middleware.DebugToolbarMiddleware' to the MIDDLEWARE list.
Ensure it is placed after 'django.middleware.common.CommonMiddleware'.
...
MIDDLEWARE = [
    # ...
    'django.middleware.common.CommonMiddleware',
    'debug_toolbar.middleware.DebugToolbarMiddleware',
    # ...
]
...
We can then configure the internal IPs and add some configuration for the js files. The toolbar will only be shown for clients connecting from specific IP addresses.
In your settings.py file, set the INTERNAL_IPS setting to include your IP address or use '127.0.0.1' and localhost for local development:
INTERNAL_IPS = [
    "127.0.0.1",
    "localhost",
]

mimetypes.add_type("application/javascript", ".js", True)

DEBUG_TOOLBAR_PATCH_SETTINGS = False
And finally, we need to add the URL of the Django debug toolbar application to the core/urls.py file.
from django.contrib import admin
from django.urls import include, path

urlpatterns = [
    path("", include("home.urls")),
    path("admin/", admin.site.urls),
    path("", include("admin_volt.urls")),
    path("debug/", include("debug_toolbar.urls")),
]
The configuration is done and you can visit http://localhost:8000 and you will notice a bar at the right of your page.
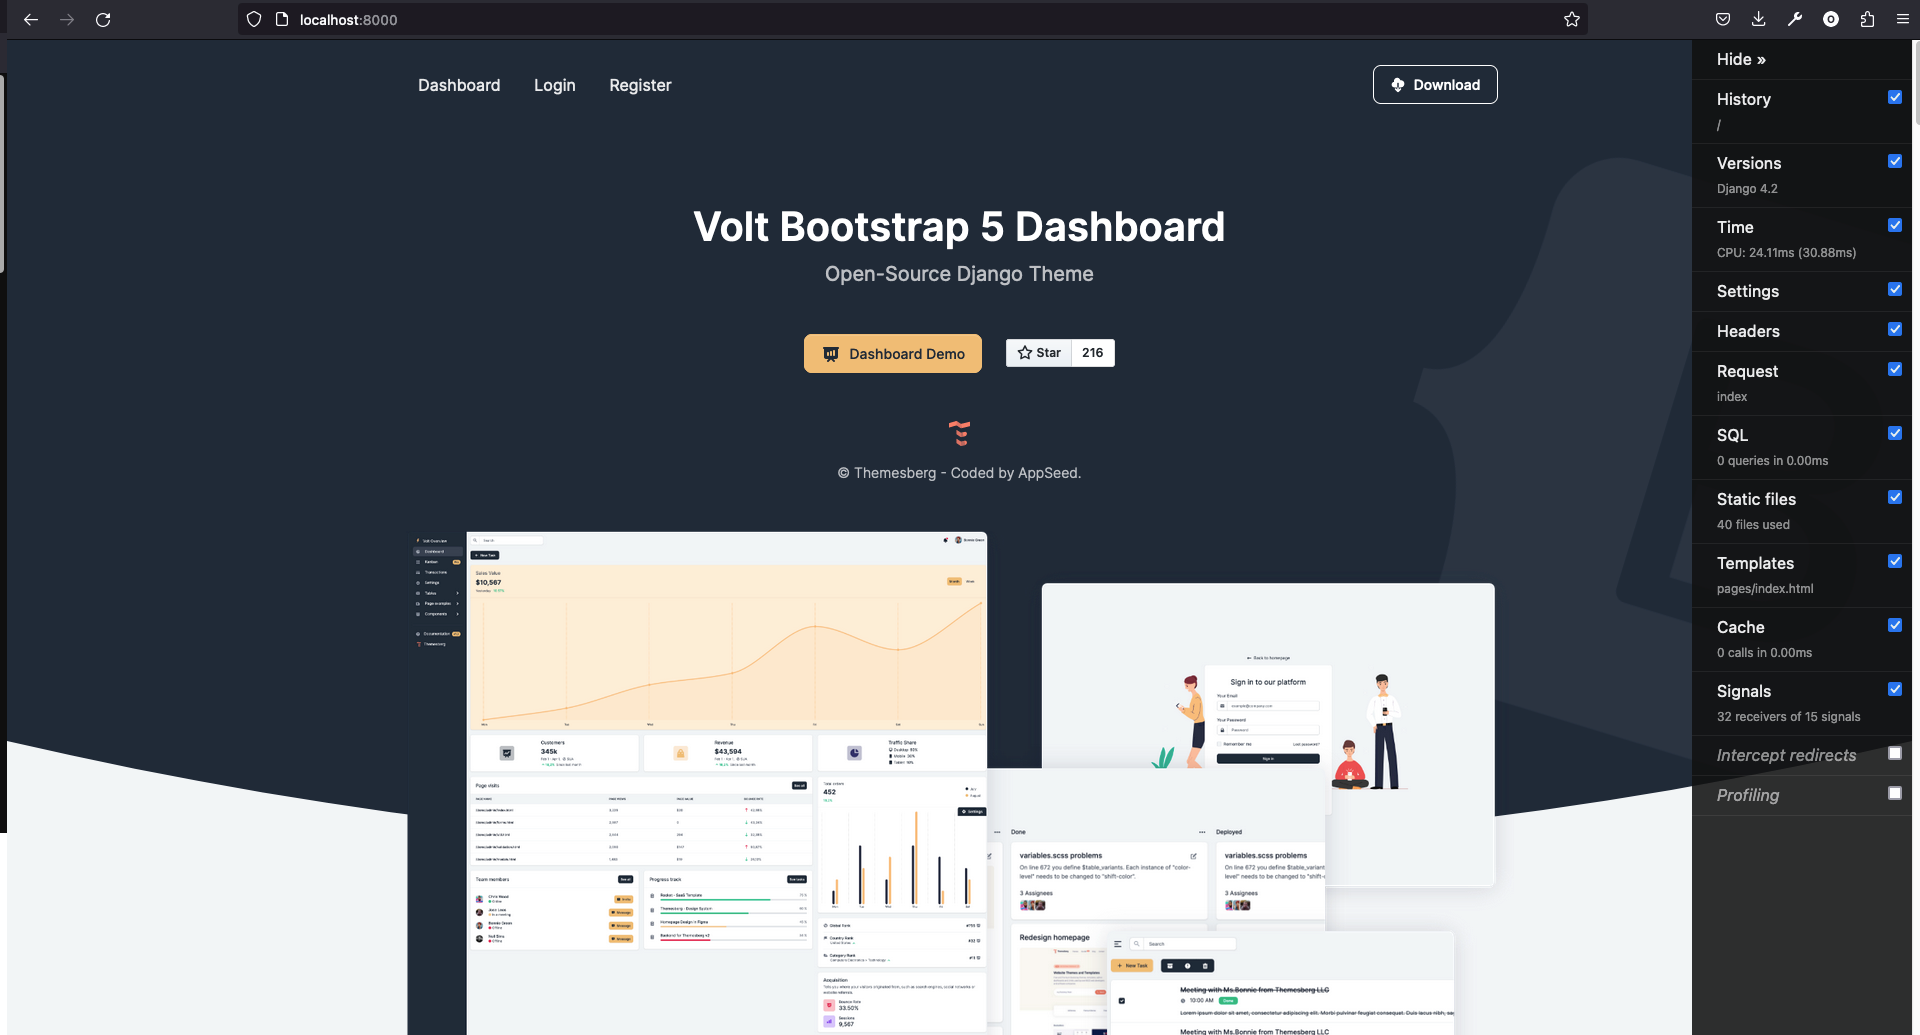
As you can see, you have many options on the panel that you can explore
Timer
Displays the time taken to process the request, render the template, and execute SQL queries.
SQL
Shows the number of SQL queries executed during the request, along with the total time taken. Clicking on this panel reveals a list of executed queries with their execution times, and you can click on each query to see the full SQL statement with parameters. This can help you identify slow or redundant queries and optimize your database interactions.
Cache
Provides cache usage statistics, including the number of cache hits, misses, and sets during the request. This can help you optimize your application's caching strategy.
Templates
Displays information about the templates used in the current request, such as the context and inheritance. This can help you debug template-related issues.
Static files
Shows information about the static files used in the current request, including the number of files and their total size. This can help you optimize your application's static file usage.
Signals
Lists the signals triggered during the request, which can be useful for debugging signal-related issues.
Request
Displays information about the current request, such as the HTTP headers, cookies, and query parameters.
Response
Provides information about the response, such as the status code, content type, and content length.
And we are done.🚀 We have just integrated django-debug-toolbar in the Django application and you can have stats that can help you optimize the application.
Coupled with pdb and logging, you have a set of powerful tools you can use for debugging in your Django application.
✅ Conclusion
In this article, we have talked about Django Debug Toolbar, pdb, and logging which are essential tools for efficient Django application development.
Utilizing these tools, you can identify performance bottlenecks, debug code issues, and optimize database queries with ease.
✅ Resources
- 👉 Access AppSeed for more starters and support
- 👉 Deploy Projects on Aws, Azure and DO via DeployPRO
- 👉 Create landing pages with Simpllo, an open-source site builder
- 👉 Build apps with Django App Generator (free service)