Django Sales Charts
Open-source Django sample provided by AppSeed on top of Argon Dashboard.
Open-source Sample provided on top of Argon Dashboard Django (free product). Django Argon Charts sample provides functional code that shows different metrics regarding a 12mo timeframe: total sales, total orders, best sale, and best month (in sales value). Information is provided using charts, widgets and a paginated data table that allows editing/adding new sales.
Features:
- Manage orders and display the information visually using charts and widgets
- Table
Ordersstore the information - properties:- ID, Product Name (mandatory), Price, Created Times, Updated Times.
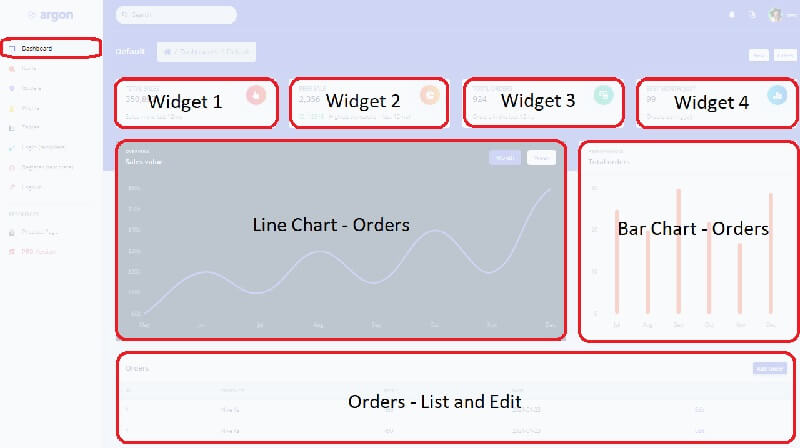
Charts: Line and Bar Charts:Line Chartshows the sales for a 12mo timeframeBar Chartshows the sales for a 12mo timeframe
Widget 1: Total Sales (in value)Widget 2: Peek Sale - transaction with Biggest ValueWidget 3: Total Orders (sum up of all transactions)Widget 4: Best Month - selected by the number of orders
Links
- Django Argon Charts - LIVE deployment
- Django Graphs and Charts - a comprehensive blog article
- Argon Dashboard Django - the original starter
How to use the app
To compile and execute the project in a local environment the workstation must have a few software tools already installed:
- GIT - command line versioning tool used to clone the sources
- Python3 - the language used to code the project
Step #1 - Clone the sources
$ # Get the code
$ git clone https://github.com/app-generator/django-argon-charts.git
$ cd django-argon-charts
Step #2 - Prepare the environment and install modules
$ virtualenv env
$ source env/bin/activate
$
$ # Install modules
$ pip3 install -r requirements.txt
Step #3 - Create SQLite database and tables
$ python manage.py makemigrations
$ python manage.py migrate
Step #4 - Create the superuser
$ python manage.py createsuperuser
Start the app, access the admin section and import the Sample File into the orders table.
Note: make sure your are connected with an
adminaccount.
Codebase Structure
< PROJECT ROOT >
   |
   |-- core/                      # Implements app logic
   |    |-- settings.py           # Django app bootstrapper
   |    |-- static/
   |    |-- templates/            # Templates used to render pages
   |
   |-- authentication/            # Handles auth routes (login and register)
   |    |-- urls.py               # Define authentication routes
   |    |-- forms.py              # Define auth forms
   |
   |-- app/                       # A simple app that serve HTML files
   |    |-- views.py              # Serve HTML pages for authenticated users
   |    |-- templates
   |         |-- dashboard.html   # The dashboard <-------- NEW
   |
   |-- orders/                    # Handles and display ORDERS   <-------- NEW
   |    |-- migrations/           # Handles and display ORDERS   <-------- NEW
   |    |   |-- __init__.py
   |    |-- static/               # order CSS files, JS, and static images
   |    |   |-- orders_assets/
   |    |       | -- jquery/
   |    |       |-- js/
   |    |           |-- order_script.js
   |    |           |-- notify.js
   |    |-- templates/
   |    |   |-- orders/
   |    |-- __init__.py        # Defines App init             <-------- NEW
   |    |-- admin.py           # Defines App admin            <-------- NEW
   |    |-- apps.py            # Defines App apps             <-------- NEW
   |    |-- forms.py           # Defines App forms            <-------- NEW
   |    |-- models.py          # Defines App models           <-------- NEW
   |    |-- signals.py         # Defines App signals          <-------- NEW
   |    |-- tests.py           # Defines App tests            <-------- NEW
   |    |-- urls.py            # Defines App routes           <-------- NEW
   |    |-- views.py           # Defines App views            <-------- NEW
   |
   |-- requirements.txt        # Development modules - SQLite storage
   |-- .env                    # Inject Configuration via Environment
   |-- manage.py               # Start the app - Django default start script
   |
   |-- **************************************
Charts Feature
This section describes the coding process for this feature that allows authenticated users to update their orders and sales.
Orders Table
This table will save the information shown in the charts on the main dashboard - Fields:
- ID: primary key
- Product Name: string
- Product Price: int
- Created Times: create transaction datetime
- Updated Times: update transaction datetime
Orders Application
The application that manages and implements all features:
- Allow users to save and edit a new order
- Via a popup window/separate window
- Populate the information on the main dashboard as presented below:
- Widget 1: Total Sales (in value)
- Widget 2: Peek Sale - transaction with Biggest Value
- Widget 3: Total Orders (sum up of all transactions)
- Widget 4: Best Month - selected by the number of orders
- Line Chart shows the sales for a 12mo timeframe
- Bar Chart shows the sales for a 12mo timeframe
Links & Resources
- Django - official website
- More Django Dashboards provided by AppSeed